Analysis of Thursday's Trades:
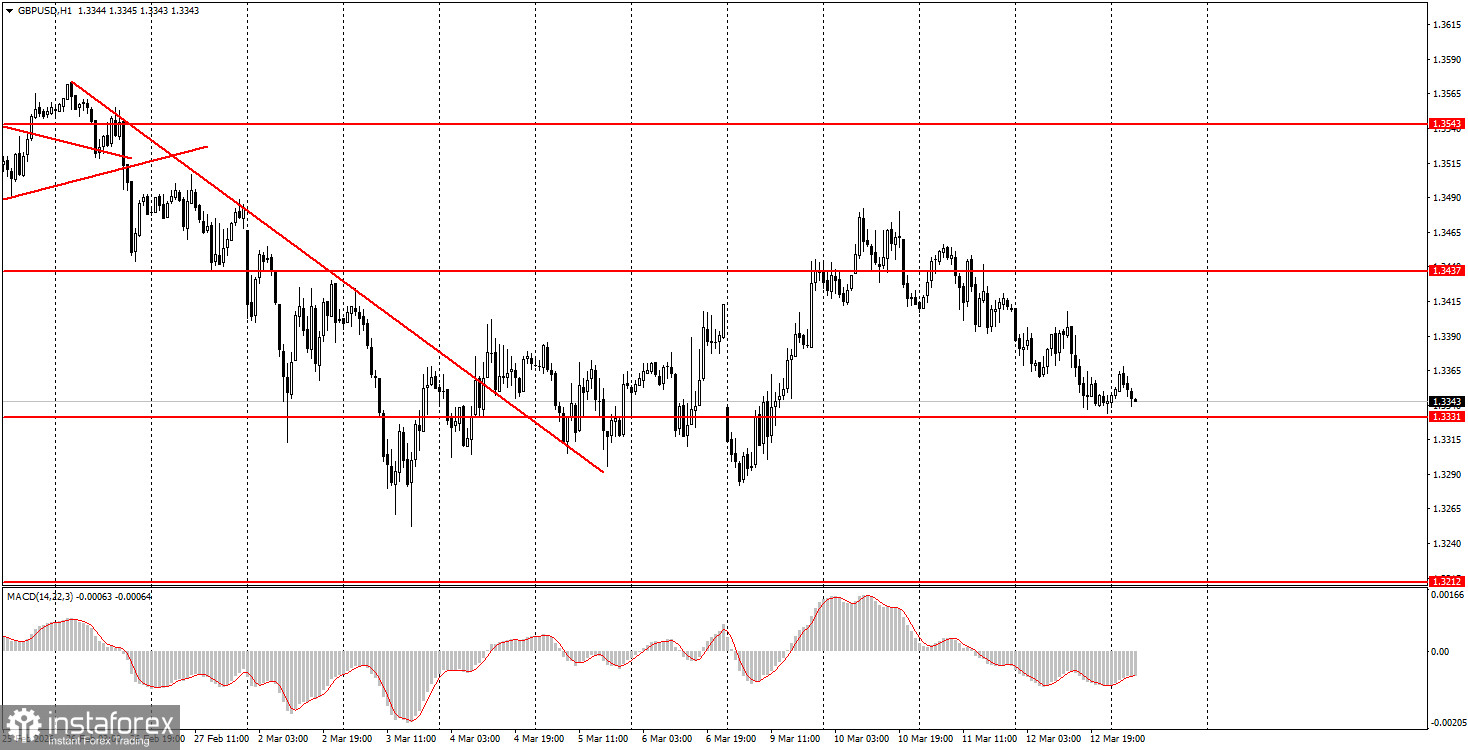
1H Chart of the GBP/USD Pair
The GBP/USD pair was also under pressure on Thursday for the same geopolitical reasons reported by media, analysts, and correspondents. Thus, the new strengthening of the U.S. currency is not related to central bank policies, Trump's trade policies, or macroeconomic reports. Today, the U.S. will release a sizable package of important macroeconomic data, but we are not confident that it will elicit a reaction. To be more precise, a response is possible and even likely if most of the American reports support the dollar. However, if most reports turn out weak, it is unlikely the market will notice them at all. The dollar continues to rise, not because of the conflict in the Middle East, but because of deteriorating global economic prospects.
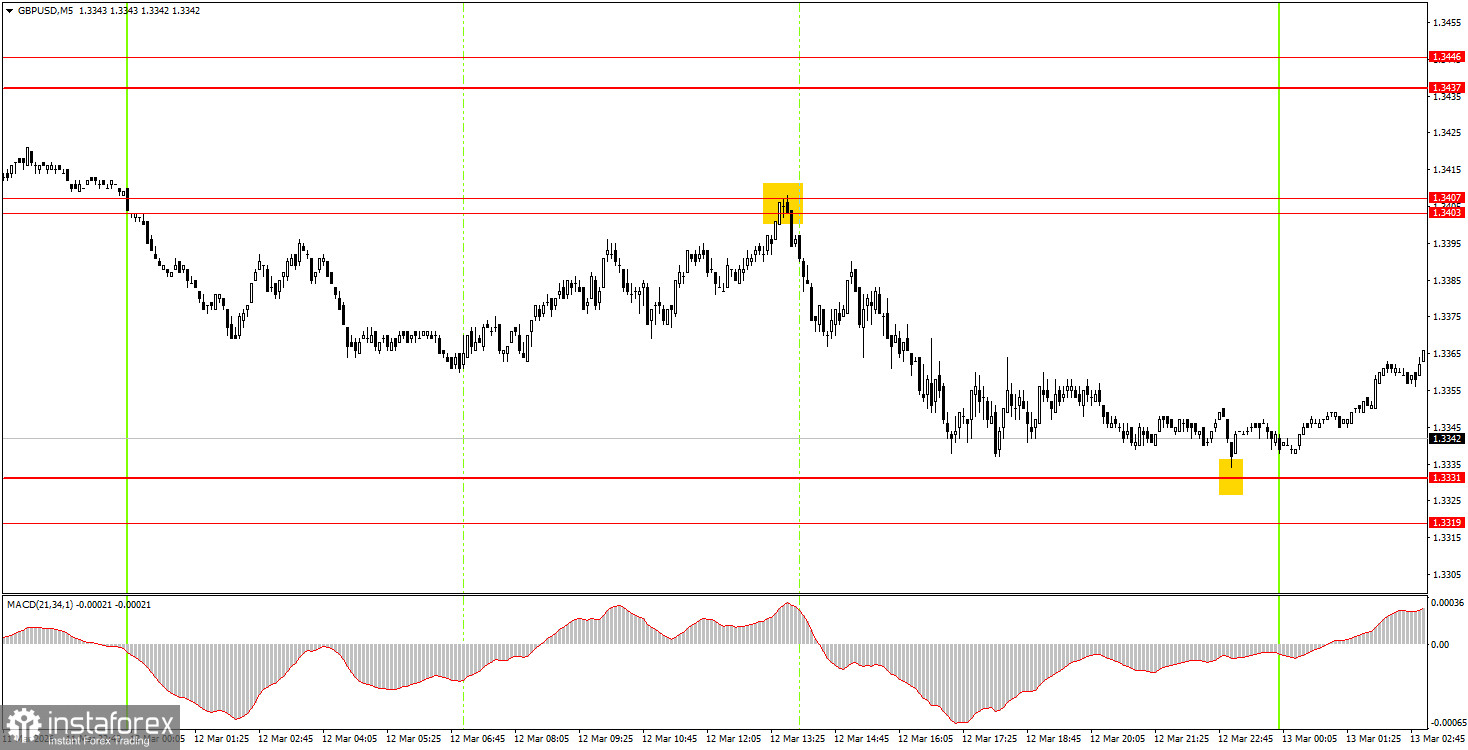
5M Chart of the GBP/USD Pair
On the 5-minute timeframe, two ideal trading signals were generated on Thursday. Before the U.S. trading session opened, the price bounced off the 1.3403-1.3407 area, allowing short positions to be opened. By the end of the day, the pair's quotes reached the nearest target—the 1.3319-1.3331 area—and bounced off it with minimal deviation. Thus, beginner traders had the opportunity to close their shorts with a profit of about 50 pips and even open long positions.
How to Trade on Friday:
On the hourly timeframe, the GBP/USD pair continues to form a "geopolitical trend." There are no global foundations for medium-term dollar growth, so we expect the resumption of the global upward trend from 2025, which could take the pair to 1.4000 at a minimum. However, in recent weeks, the situation has not always favored the British currency, and the market is completely focused on the war in the Middle East, which directly impacts the value of the U.S. currency.
On Friday, beginner traders may open long positions if there is a rebound from the 1.3319-1.3331 area, targeting 1.3403-1.3407. Price consolidation below the 1.3319-1.3331 area will allow for opening new short positions targeting 1.3259-1.3267.
On the 5-minute timeframe, trading can currently be done at the following levels: 1.3096-1.3107, 1.3203-1.3212, 1.3259-1.3267, 1.3319-1.3331, 1.3403-1.3407, 1.3437-1.3446, 1.3484-1.3489, 1.3529-1.3543, 1.3643-1.3652, 1.3695, and 1.3741-1.3751.
On Friday, the UK is scheduled to release monthly GDP and industrial production data. In the U.S., the core Personal Consumption Expenditures (PCE) index, the consumer sentiment index, fourth-quarter GDP (second estimate), personal income/expenditure data for American consumers, and durable goods orders will be published. There will be many reports today, so they may affect the dollar's movement.
Key Principles of the Trading System:
- The strength of a signal is determined by the time it takes to form the signal (bounce or breakout). The less time taken, the stronger the signal.
- If two or more trades have been opened at a particular level based on false signals, all subsequent signals from that level should be ignored.
- In a flat market, any pair can form many false signals or none at all. In any case, at the first signs of a flat trend, it is best to stop trading.
- Trading deals are to be opened during the period between the start of the European session and the mid-American session, after which all trades should be closed manually.
- On the hourly timeframe, it is preferable to trade based on signals from the MACD indicator only when there is good volatility and a trend confirmed by a trend line or trend channel.
- If two levels are positioned too close together (5-20 pips apart), they should be considered a support or resistance area.
- Upon moving 20 pips in the correct direction, a Stop Loss should be set to breakeven.
What to Look for on the Charts:
Price levels of support and resistance are levels that serve as targets when opening buys or sells. Take Profit levels can be placed around them.
Red lines represent channels or trend lines that show the current trend and indicate the direction in which it is preferable to trade now.
The MACD indicator (14,22,3) – the histogram and the signal line – is a supporting indicator that can also be used as a source of signals.
Important speeches and reports (always included in the news calendar) can significantly affect the movement of the currency pair. Therefore, during their release, trading should be done with utmost caution, or traders should exit the market to avoid sharp price reversals against the previous movement.
Beginning traders in the forex market should remember that not every trade can be profitable. Developing a clear strategy and effective money management are the keys to long-term trading success.