Analysis of Tuesday's Trades:
1H Chart of the GBP/USD Pair
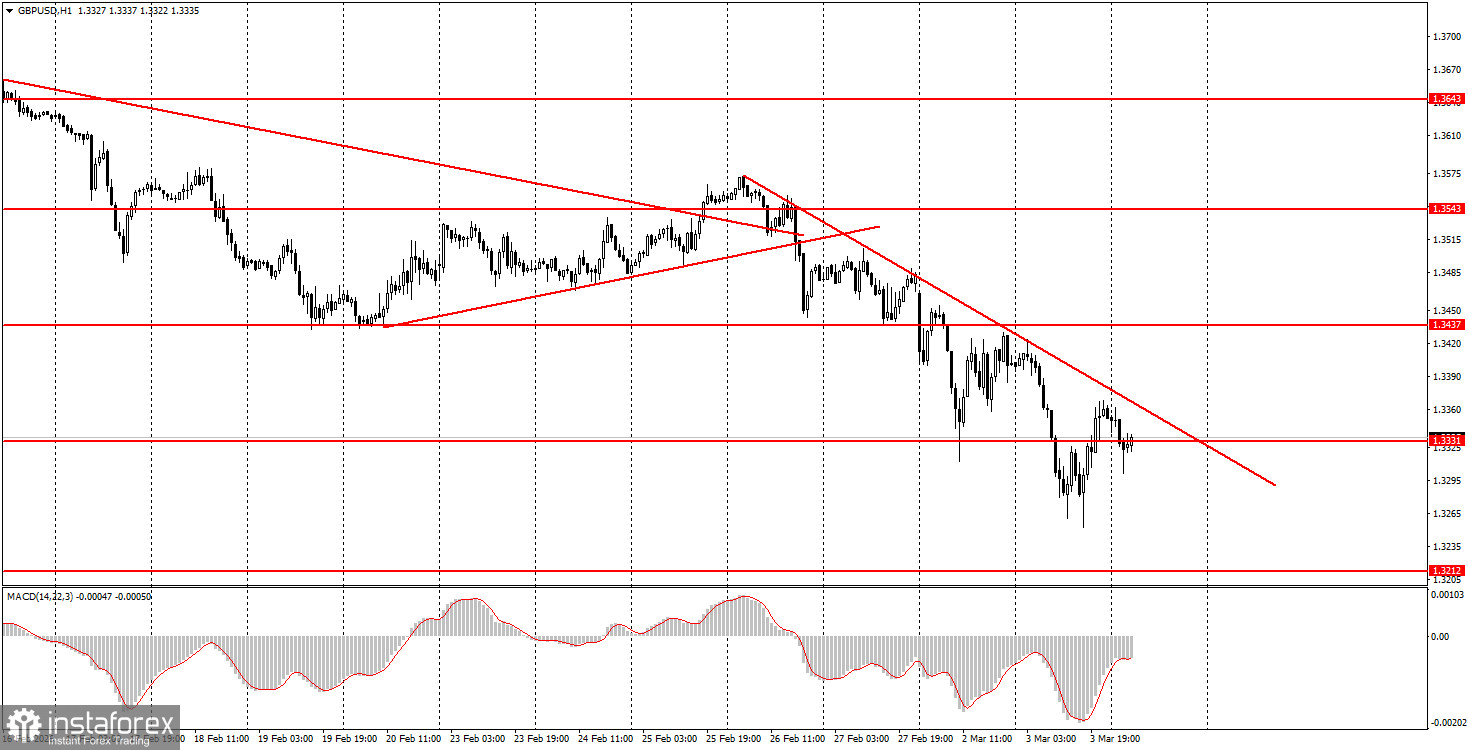
The GBP/USD pair continued its downward movement on Tuesday, primarily driven by the same geopolitical factors. There isn't much more to add here. The only noteworthy development is Trump's announcement, in which the American president pledges to ensure the safety of tankers in the Strait of Hormuz to stabilize global oil and gasoline prices. If the US Navy can protect tankers transporting oil around the world, it would indeed ease tensions in the global markets. In this case, the dollar could begin to fall. In our opinion, the market is currently reacting not to the war in Iran and its neighboring countries, but to the shock in the energy markets triggered by this war. Therefore, calming the commodity markets is essential for stabilizing the situation in the global markets.
A new descending trend line has formed on the hourly timeframe; its third breach in the last five weeks would indicate a transition to an upward trend.
5M Chart of the GBP/USD Pair
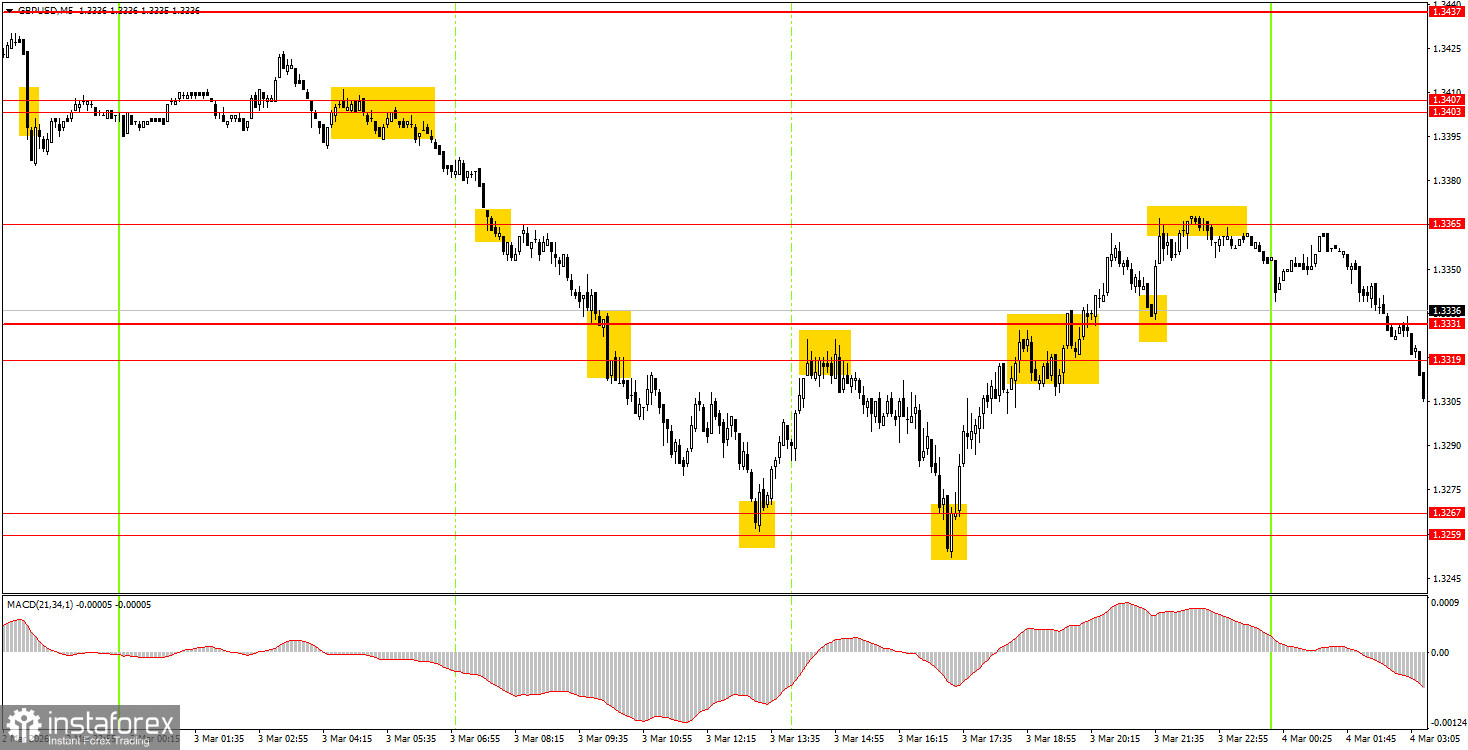
In the 5-minute timeframe, about 10 trading signals were generated on Tuesday. Initially, the price fell below the 1.3403-1.3407 area, then declined to the 1.3259-1.3267 area. Thus, on this short position alone, beginner traders could have earned around 110 pips. Afterwards, three bounce signals were formed in the ranges 1.3319-1.3331 and 1.3259-1.3267, each of which also yielded a profit. The day concluded around 1.3365, which was executed perfectly and generated a trading signal.
How to Trade on Wednesday:
On the hourly timeframe, the GBP/USD pair continues to form a "geopolitical trend." There are no global foundations for the medium-term growth of the dollar, so in 2026, we expect the continuation of the global upward trend from 2025, which could lead the pair to the 1.4000 mark at a minimum. In recent weeks, the situation has not often favored the British currency, and the market has frequently ignored negative news from America, which has supported the US currency.
On Wednesday, beginner traders can open long positions if the price breaks through the area of 1.3319-1.3331, targeting 1.3365 and 1.3403-1.3407. A consolidation below the 1.3319-1.3331 area will allow for new short positions with a target of 1.3259-1.3267.
On the 5-minute timeframe, trading can currently be conducted at levels 1.3203-1.3212, 1.3259-1.3267, 1.3319-1.3331, 1.3365, 1.3403-1.3407, 1.3437-1.3446, 1.3484-1.3489, 1.3529-1.3543, 1.3643-1.3652, 1.3695, 1.3741-1.3751. No significant events are scheduled in the UK for Wednesday. In the US, the ADP and ISM reports will be released, which are worth paying attention to. However, the market may remain in turmoil due to events in the Middle East.
Key Principles of the Trading System:
- The strength of a signal is determined by the time it takes to form the signal (bounce or breakout). The less time taken, the stronger the signal.
- If two or more trades have been opened at a particular level based on false signals, all subsequent signals from that level should be ignored.
- In a flat market, any pair can form many false signals or none at all. In any case, at the first signs of a flat trend, it is best to stop trading.
- Trading deals are to be opened during the period between the start of the European session and the mid-American session, after which all trades should be closed manually.
- On the hourly timeframe, it is preferable to trade based on signals from the MACD indicator only when there is good volatility and a trend confirmed by a trend line or trend channel.
- If two levels are positioned too close together (5-20 pips apart), they should be considered a support or resistance area.
- Upon moving 20 pips in the correct direction, a Stop Loss should be set to breakeven.
What to Look for on the Charts:
Price levels of support and resistance are levels that serve as targets when opening buys or sells. Take Profit levels can be placed around them.
Red lines represent channels or trend lines that show the current trend and indicate the direction in which it is preferable to trade now.
The MACD indicator (14,22,3) – the histogram and the signal line – is a supporting indicator that can also be used as a source of signals.
Important speeches and reports (always included in the news calendar) can significantly affect the movement of the currency pair. Therefore, during their release, trading should be done with utmost caution, or traders should exit the market to avoid sharp price reversals against the previous movement.
Beginning traders in the forex market should remember that not every trade can be profitable. Developing a clear strategy and effective money management are the keys to long-term trading success.